
What is futurecasting (and why should you care)?
There are two paths to innovation. One resides in our timeline just beyond now—solving a problem that exists today with technologies and resources available today. For comparison’s sake, let’s call it simple forecasting. The other path resides in our timeline years into the future—solving a problem that is, at least according to the tea leaves of trends and R&D pipelines, imminent, using technologies or resources that may not be currently available. That’s futurecasting.
No one can predict the future. But smart innovators still try.
There are two paths to innovation. One resides in our timeline just beyond now—solving a problem that exists today with technologies and resources available today. For comparison’s sake, let’s call it simple forecasting. The other path resides in our timeline years into the future—solving a problem that is, at least according to the tea leaves of trends and R&D pipelines, imminent, using technologies or resources that may not be currently available. That’s futurecasting.
Why would an organization spend time and resources today solving a problem that may not exist for years?
For starters, it aids in long-term strategic planning. Simply informing your forward-looking opinions with as much research and forethought should add an increased level of confidence in those opinions and resulting decisions. Second, and perhaps more important, preparing for that predicted future you’ve so meticulously mapped out might take substantial research and development.
Further, you may require the entirety of that time span to be prepared to offer the most relevant product at the right time. But you won’t know what you’ll need or how to get there unless you spend the time speculating, planning and resourcing today. So, as we navigate the innovation path long into the future, what are the steps we need to ensure we’re heading in the right direction with the proper resources?
Futurecasting using the Narrative-Based Innovation process
Narrative-Based Innovation was created to maintain continuity of purpose and clarity of vision throughout any design-thinking project. It’s an extraordinarily useful framework for something as fraught with uncertainty as futurecasting.

Empathize — Understand the core human needsWhether you perform deep ethnographic research, conduct focus groups or scour secondary research sources, do whatever you can to understand the breadth of factors, conditions and influences that drive people’s emotional motivations for engagement in whatever industry or category for which you intend to innovate. Understand what they’re getting from current transactions—satisfaction and disappointments alike. Understand what jobs they’re hiring your product or service to do today. Understand what drives decisions around alternatives and substitutes. Of course, you should document the behaviors and transactional WHATs of your market, but for futurecasting, the more important aspects to understand are the emotional WHYs that might inform the need for a new solution in the future. Now, document those drivers and motivations. You’ll need them when drafting your narrative!
Personify — Create your hero(es)At this step, you should have a decent understanding of the type of person(s) who is, or might be in the future, engaging with your innovations as well as what emotions are driving their decisions and engagements. In this step, start to build a day in the life narrative for these heroes. Systematically think through and document how these heroes might experience the world before, during and after engaging with your business.
Project — Set a time frame, consult your road map, map out trends Understanding exactly how far out into the future you wish your innovation to exist is critical to the potential success of your process. As anyone in technology or fashion will tell you, timing is everything. It’s also critical to managing scope within your project.So, pick your time frame—two, five, 10 years—and focus exclusively on understanding what will (or probably might) be different about the world, your customers, your markets, technology, etc., at that specific moment. Do you have projects in your R&D pipeline that should be in the market by then? How are the breakouts of consumer segments predicted to have shifted in your markets and the general population? How will social, economic, cultural norms have shifted?Every business or industry would have a unique set of factors and drivers they would need to consider. The point here is to build as much dimensional understanding of the prevailing environment and motivations influencing your heroes’ decisions.The outputs of this step can take many forms. You could write a series of “headlines from the future.” You could create a “top 10 list of things every time traveler should know” about your specific date in the future. You could write the CEO a letter from your company’s annual report for the year prior to your future date. No matter what format you choose, give those predicted values and trends as human a face as you can imagine.
Build & Define — Walk your hero(es) through your future worldHere, you’ll want to envision emerging challenges or opportunities your hero might encounter in the world we just predicted. What of the factors you mapped out might have an influence on your heroes’ behaviors, motivations or ability to engage with your business? What are the basic human needs driving those behaviors and motivations? And what within those challenges or motivations might represent a foundation for innovation? Here, you’ll write the beginning of our hero’s journey (or heroes’ journeys) as they navigate this future world. You’ll want to explore how they encounter the challenges you’ve defined/predicted.Walk them through a typical day. As you document the what and where of their day, dig into the emotions and motivations that directly and indirectly affect the hero’s relationship to their surroundings. What personal or professional relationships matter to them? Bring them from their general world to a moment of joy or frustration that represents a solvable moment for you to innovate around. Can you make a great moment better? Can you reduce friction or eliminate some form of frustration entirely?Hold the story here and use that moment to craft your “How might we…” statement to use as the fuel for your ideation, coming next.
Ideate solutions for those challenges. Now that we have a narrative beginning to build around our hero and the challenges they face in the world at the specified future point in time, it’s time we do that hero a favor and imagine all of the ways we might solve for whatever challenge we envisioned in the previous step. How to conduct an ideation session is a bit out of scope for the level of detail we are covering here, but within that session, all participants should have suitable familiarity with the hero and the circumstances that led them to require our collective problem-solving. But coming out of the session, you should have a shortlist of prioritized solutions to serve as the foundations for the next chapter—the prototype narrative.
Create the (prototype) narratives of the heroes’ encounters with the solutionIn this step, you can use a story to work through the most important moments of engagement between the hero and the solution(s) imagined in the ideation phase. Don’t skimp on the details here. It’s critical that the full experience be considered, described and rationalized. The trick is to be thorough enough in the telling of the encounter that anyone with no prior knowledge of the solution should be able to envision the experience and make a rational judgment as to its potential desirability because next, we share and test those solution narratives to begin to quantify what the viability and market prospects of these solutions.For testing, you may want to create prototypes that take the form of text-based stories, storyboards, explainer videos, dramatic enactment video, etc. What level of fidelity and production value will depend on the level of confidence you expect to glean from the outcome. Generally, the broader the concept you’re testing, the lower fidelity your prototypes need to be.
Share/Test—Testing can take a number of forms. If you want to understand raw market potential, you may do more quantitative testing, like an online survey. If you’re looking for more nuanced evaluations and feedback, something qualitative, like focus groups, individual interviews or dyads, makes more sense. In any case, present the narratives and document the response. Is this a concept people find desirable or, given the unexpected nature of some of the ideas you’re likely to present, even believable?
Iterate — No one should expect to get every innovation right on the first try. If you’re creating something new, unexpected issues or reactions will always arise. Hence that whole testing phase. If you think, after testing, that you’re still confident in the problem as defined, take stock of the feedback received in testing and circle back to the ideation phase and have another go! If the feedback points to a rethinking of the problem itself, circle back to the definition phase and re-craft your “how might we…” question and, once again, head back to ideation. Rinse and repeat until you have a clean answer to your hero’s challenges.
Craft the happy ending — As you envision your hero at the end of the story, having experienced your solution, document in your narrative how you expect the hero would feel. What expectations have been met? What needs have been satisfied? How might they express the engagement from their own point of view?
Even the future deserves a good first draft.
It would be great to say that the inevitable result of this process would be an ironclad road map for what’s next, but it’s more likely that the process acts as a great compass for pointing toward what direction to wander, and, more importantly, where your competition might be heading as well. I’ve said before that the best way to be wrong is to try and predict the future. But I also believe the best way to improve your odds is to create that future yourself.
The Summer Media List for Innovators and Design Thinkers
There’s an amazing amount of inspiring content being developed and distributed on the topics of innovation and design—much of it available free of charge! Let’s take a look at the tip of this great educational iceberg.
There’s no shortage of great ideas.
I read an article a few months back that made the bold assertion that we are in a new golden age of television. Of course, the word television was being used in its more modern sense, including programming created and distributed by over-the-top providers like Hulu, Amazon, HBO, Netfllix and Youtube. Ultimately, the argument posited recognized that attaining a high degree of success in a fractured media landscape requires content that is both high quality and original.The good news is that a cursory review of the entertainment landscape seems to support that argument. The better news is that the same holds true when it comes to media created about innovation and design. There’s an amazing amount of inspiring content being developed and distributed on the topics of innovation and design—much of it available free of charge! Let’s take a look at the tip of this great educational iceberg.
Listen: The Data Skeptic (Kyle Polich)
To paraphrase something Albert Einstein once said, “If you cannot explain it to a six-year-old, you don’t understand it well enough yourself.” Data Skeptic is a podcast about data science, machine learning and AI, et al, that makes this complex, highly technical subject matter highly accessible. The show is hosted by Kyle Polich and Linh Da Tran and succeeds in clearly explaining high level concepts in data science in an entertaining way. You can find the episodes at their website and on iTunes.
Read: Change by Design (Tim Brown)
Change by Design is a design thinking classic. Brown’s exposition on the value of the design thinking process developed at Ideo moves beyond its use in product and service creation and offers insights into how the approach can have a positive impact on businesses as a whole. The book is rich with detailed examples and anecdotes (some which have held up less well under the ravages of time).
Listen: a16z (Andresen Horowitz)
You can accuse internet pioneer Marc Andresen of many things, however, not having an opinion is not one of them. The a16z podcast tackles (as described on iTunes) tech and culture trends, news, and the future—especially as ‘software eats the world’. From industry experts to business leaders, every episode will teach you something and make you think differently, for better or worse.
Watch: Exit through the gift shop. (Banksy)
This documentary film, created by notorious/infamous street artist Banksy is pure genius. It’s both a treatise on the democratization of culture as well as a manual on the subversion of institutions, not to mention an amazing case study on the power of positioning and messaging. There are innumerable peelable layers in this presentation of the story of “Mr. Brainwash,” ostensibly a video-camera-obsessed owner of a second-hand clothing store in Los Angeles and his accidental journey to darling of the art community. It’s available on all major streaming video services.
Listen: 99% invisible (Roman Mars)
The title of this podcast is a reference to “all the thought that goes into the things we don’t think about.” Topics range from the history and design of Barcelona’s La Saragda Familia cathedral to the near irrational affinity some patrons had for the unique patterned carpets at the Portland airport. It’s one of those media experiences that surpass any expectations the summary descriptions might offer. If you are among the 1% who tends to think about and notice design, you’ll love (and learn a lot from) this podcast.
Bonus listen: Song Exploder (Hrishikesh Hirway)
If most people don’t think about how the objects around them come into being through design, even fewer probably think about how the music we hear on the radio, streaming or in movie and television soundtracks moves from inspiration to completed recording. Song Exploder, as it’s described on the website, is a podcast where musicians take apart their songs, and piece by piece, tell the story of how they were made. And, admittedly, I find it a fascinating glimpse into a design process most never get to see.
Sit back, relax, and you just might learn something.
This is indeed the golden age of media, when anyone can learn just about anything from any number of experts. Hopefully, we’ve helped sift through a bit of the noise so you can learn something valuable, about topics you care about, from the next in the business. So, now, load up the mobile device and plan your next road trip!
Why Persona Development Should Be A Part Of Every Customer Experience Design
We understand the importance of persona development, yet many still have a difficult time selling in this important step within their organizations. When discussing the persona development process with clients, the same questions arise at the outset of every project. We’ve put together the basic answers to these questions.
As strategic marketers and UX strategists, we understand the importance of persona development, yet many still have a difficult time selling in this important step within their organizations. When discussing the persona development process with clients, I tend to receive the same questions at the outset of every project. So, I thought it might benefit our readers to tackle the basic answers to many of those questions in this post. Here it goes.
We have segmentation. Why do we need personas?
Customer segmentation enables marketers to understand the similarities in customer groups—whether it be demographic or behavioral commonalities—to uncover which customers have the most growth potential, ultimately leading to understanding which customers need the most attention.On the other hand, personas provide a more personalized “character”—one based upon robust qualitative and sometimes quantitative research methodologies. These personas become the center of a user-centric story. The fictional hero, if you will, of a story that organizations can use as a roadmap for envisioning and evaluating what will be a truly motivating customer experience. Real end-users aren’t available throughout the strategic development and design process. However, a persona, through their story, gives them a voice by proxy that can be referred to throughout the experience design process enabling more strategic decision making.
Why should we invest in customer insights to develop personas?
While personas are fictional characters, they are characters developed as a composite of real end-users and insights uncovered during secondary and primary qualitative or quantitative research. Investing in a customer research initiative to develop personas ensures your personas are based in reality. Providing a true representation of the goals, motivations, nuance and behaviors of end-users to your project team minimizes any unconscious bias or assumed perceptions within the team or organization.
What’s the ROI of persona research?
Simply put, the ROI is time—and therefore money. Personas ensure project teams are grounded in an understanding of the user whose problem they’re solving. They’re better able to avoid rabbit holes and making assumptions by developing solutions based on where their end users currently are—resulting in more efficient problem solving and often, less rework.
Finally, if your organization likes concrete numbers, here’s a big one.
Forrester reports a web redesign using personas can provide a return of up to four times over a site design not using personas.1 I believe the same, if not greater, return can be expected using personas to develop any customer experience solution.
Math for Marketers: How to Evaluate Growth Opportunities
Marketing is always a blend of art and science but lasting success is calculated. These formulas can help simply provide an additional objective sense of perspective in the planning process.
In the more than 30 years this agency has existed, we’ve never had a client come to us and reveal that they had unlimited time and unlimited funds to apply to their growth challenges. When developing a strategic roadmap, each and every one had to weigh the opportunities and opportunity costs of every decision and prioritize those efforts and investments that will yield the greatest net returns to the business.As one undergoes the strategic planning process, understanding what potential opportunity may result from any strategic priority will undoubtedly require a mix of assumption and intuition, and, more importantly, basic quantitative analysis. In this post, we wanted to outline a couple of basic but powerful formulas and processes to assist in some of the most common areas of inquiry: market sizing and budget prioritization. In other words, “how big is the opportunity, overall?” and, “How should budget dollars be allocated to ensure maximum average returns?”
Part 1—How to calculate potential market size.
Estimating the size of any new market is a mixture of art (the assumptions are you are making) and science (the hard evidence you have to quantify the validity of each assumption). Now, there are plenty of folks willing to stake their reputations and their businesses on a purely art-based approach—you could say relying on emotional confidence versus statistical confidence—but the following formulas deliver far more reliable results if you backup your input variables with actual research data. So, what are the variables that go into your formula?
Total population (P): This simply corresponds to the total population in your trading area. That could be local, regional, national or global.N = Total Geographical Population
Percentage of Target Customers (PTC): The percentage of the total population that fits the target segments most likely to be an active customer.
Average Transaction Quantity (Q): The average quantity purchased by a single user at a time.
Frequency of purchase (F): How many times the product or service is purchased in the most relevant period of time (annually/quarterly, etc.).
Price of Product (P): What the expected revenue generated is per transaction.
Market Size (MS) Formula = (get ready, this is the math part) MS = P * PTC * F * P
An example: Since the advent of bike share programs around the country, articles keep popping up about the need for single-use or limited-use helmets. So, let’s say you’ve just invented a new recyclable engineered paper bicycle helmet for bike share usage. And you want to launch it in a test market, like Chicago. In 2017, Divvy claimed more than 37,000 members, so in this example, we can use that for P.
P=37,000
But all 37,000 will not be in the market for our new helmet. How many will be? This is where it would behoove you do some actual quantitative research (the science) among Divvy members to determine levels of need and interest. Let's say we conducted a quantitative online survey with a representative sample (300) Divvy members that indicated 50% of them already own their own traditional bike helmets. Of the remaining 50%, half again of those will never wear a helmet. So, we are left with 25% of the original population that do not own a helmet and are not opposed to it. But only half of those (the remaining 12.5%) said they would be interested in purchasing your helmet. So, in the end:
PTC=.125 (or 12.5%)
Each consumer would generally only purchase one helmet at a time, so:
Q=1
But the helmets only last about 4 weeks before the paper breaks down and most Divvy members only bike 3.5 months out of the year. Discounting for the fact that most people will not be diligent about replacing the helmets in a timely fashion, let's put the frequency of purchase at 2.5 per year.
F=2.5
And, finally, you've designed the helmet to sell for about $10, so:
P=10
So, let’s plug those into the formula!MS = P * PTC * F * P
Market size (MS) = 37,000 * .125 * 1 * 2.5 * 10
Or…
MS= $115,625
After going through those calculations, you realize there’s a reason the idea of single-use helmets comes up every year, yet no one is developing single-use helmets.
Part 2— How to prioritize marketing budgets for growth.
Every marketer faces similar challenges when it comes to budget prioritization. It always comes down to determining against which products or services do you spend what portion of the budget. And always, the calculus centers on ultimately realizing the greatest returns for every dollar spent. Surprisingly, even though this is an ongoing concern, many marketers rely more on gut intuition than quantitative reasoning.To add a little more quantitative reasoning into the mix, we’ll introduce you to another simple calculation (courtesy of McKinsey & Co), called the customer growth index (CGI). It’s an interesting way to understand the correlation between initial consideration and growth potential.
Simply put, to arrive at the CGI, you take the percent of time your brand is a member of your customers’ initial consideration set, then divide that by that your brand’s current market share, and finally, multiply that result by 100 to create an index. The closer to 100, the greater the brand’s ability to keep up with the pace of growth in the market as a whole.
CGI= %consideration * %marketshare * 100
McKinsey uses this for looking at overall brand, but we think it can be a useful tool if you know that same inputs with in each of your product categories. Let’s say Nike was evaluating marketing budget allocations for shoes, apparel and tech wearables. By calculating the Nike CGI for each product category, they would have a better indication of the brand health in each, and which are more or less likely to experience growth for each marketing dollar applied. It’s not the end all determination of which categories should get what budgets, but it’s a strong signal of momentum that should be taken into consideration.
Lasting success is calculated.
Marketing is always a blend of art and science. No matter what the size the market opportunity or propensity for growth, we all need to deliver memorable, motivational experiences for our customers. In the end, these formulas can help simply provide an additional objective sense of perspective in the planning process.
Apple vs. The Mad Men: Can marketing and privacy co-exist?
The release of iOS 11 could introduce the greatest threat to the Web as we know it. That’s because Apple is introducing strict new privacy protection in its mobile Safari browser that will prevent ad networks from effectively tracking your browsing history through cross site tracking. While advertisers claim the process is benign, many believe that in the hands of a malicious entity, this information could be used to nefarious ends.
Apple is drawing a line in the sand around privacy.
Digital media networks are claiming that the release of iOS 11 will introduce the greatest threat to the Web as we know it. That’s because Apple is introducing strict new privacy protection in its mobile Safari browser on the iPhone. The update to Apple’s Safari browser prevents ad networks from effectively tracking your browsing history through the use of cross site tracking. According to this blog post by John Wilander on the WebKit.org (author’s note: WebKit is the open source code foundation for Apple’s Safari browser), the new intelligent tracking prevention features stops third-party sources (e.g.: major ad networks) from effectively creating a copy of your browsing history via tracking cookies stored on your device.Here’s how John describes the process in his post: “Imagine a user who first browses example-products.com for a new gadget and later browses example-recipies.com for dinner ideas. If both these sites load resources from example-tracker.com and example-tracker.com has a cookie stored in the user’s browser, the owner of example-tracker.com has the ability to know that the user visited both the product website and the recipe website, what they did on those sites, what kind of web browser was used, et cetera. This is what’s called cross-site tracking and the cookie used by example-tracker.com is called a third-party cookie. In our testing we found popular websites with over 70 such trackers, all silently collecting data on users.”While advertisers claim the process is benign, Apple deems the process overly intrusive, offering a data cache rich enough for any interested party to effectively reconstruct your complete browsing history. In the hands of a malicious entity, that information could surely be used to nefarious ends.
And the ad industry is living up to the term, “Mad Men.”
According to a sternly worded press release, penned jointly by a coalition of industry associations which includes the 4A's—American Advertising Federation, Association of National Advertisers, Data & Marketing Association, Interactive Advertising Bureau, and Network Advertising Alliance (hereafter referred to as the Industry)—the Apple update will effectively break the commercial Web. Or, at least, make it prohibitively difficult to monetize. In the joint press release, these industry groups assert they are “deeply concerned about the Safari 11 browser update that Apple plans to release, as it overrides and replaces existing user-controlled cookie preferences with Apple's own set of opaque and arbitrary standards for cookie handling.” Ultimately, they claim “Put simply, machine-driven cookie choices do not represent user choice; they represent browser-manufacturer choice.”
Did consumers ever really choose?
Running a company that makes its bread and butter crafting digital experiences, I can wholeheartedly and unquestionably agree there that browser cookie technology is fundamental to ensuring users have a seamless and personalized experience on the Web. But it is tough to agree with the industry’s position that the highly aggressive tracking and consumption of users’ effectively unfiltered browsing history was in any way a user choice that Apple is now violating.I guarantee that if I was ever presented with any detailed terms of service outlining how, and what detail, my browsing history would be collected and reported back to third-party ad networks, I cannot remember the moment I accepted them. I would assume most users’ experience around that issue is similarly clouded by the fog of our myriad collective browsing experiences.
Is Apple overstepping their authority?
Put simply, I don’t think so. The company is, at its core, a purveyor of hardware and user experiences. If they deem the best user experience on their platform to be founded in a more conscientious protection of their users’ privacy, it’s difficult to see how their approach isn’t the smartest means to that end.So, what is apple proposing? Again, the WebKit.org post describes it thus: “If the user has not interacted with example.com in the last 30 days, example.com website data and cookies are immediately purged and continue to be purged if new data is added.”And, further, they simplified it into this easy-to-follow chart:![]()
Ad-infinitum?
It seems the Industry would prefer that in the long run, with enough data-sharing and partnership agreements, everyone would be, by virtue of any number of unread terms of service, opted into everything, in perpetuity. It’s a convenient position in the short term, but one that ultimately, I believe, will lead to consumer backlash far less manageable in the long run than their current Apple problem.
Can’t we all just get along?
It may be tough to remember at this point, but we used to have a political system in the US where two conflicting parties would discuss an issue over which they differed and come to a compromise that was workable, even if both parties were slightly unsatisfied with the outcome. Ultimately this is where I think this issue should and will end up, in a compromise.A day may be too short a time to allow tracking cookies to work their personalization magic in a way that satisfies the commerce needs of content providers and the ad networks that drive their revenue streams, but it’s hard to imagine a world where unlimited access to browsing histories doesn’t constitute a massive violation of privacy. In the end, it’s a question that needs to be resolved. Publicly. With open debate and full transparency for consumers. And when no interested party is fully satisfied with the outcome—Apple, the industry or consumers—we’ve probably derived the right solution.
Metrics That Move Your Understanding From “What” To “Why”
As marketers, we look most often at the analytics that tell us if we are connecting enough. Let’s go beyond reach and frequency, and discover a few underutilized metrics that provide a true indication of how well you are connecting (and if you are connecting) with your most valuable targets. Content warning: there will be some math involved.
Are your dashboards revealing the whole story?
As marketers, we’re prone to collecting all the data we can about our customers and how well our programs are performing. We pour over our Google analytics, CRM conversions, and social likes every time we open our marketing dashboards. And as a whole, we look most often at those numbers that indicate reach or scale–those that tell us if we are connecting enough. But there are a few underutilized metrics most dashboards ignore or omit, metrics that go beyond reach and frequency and provide true indications of how well we are connecting (and whether we are connecting) with our most valuable targets. Let’s look at a few metrics and see how they might provide a deeper level of insight. Content warning for marketing folks: there will be some math involved.
Calculate your social growth quality index.
This index is a directional indicator of the quality of the new followers you’re adding to your rolls. It indicates whether you’re simply growing your base community numbers or, more preferably, are providing content or building a community that is increasingly creating more powerful connections with your brand. The data you need is your followers and average engagement numbers for periodic intervals over time. Your data could be as granular as measurements at the individual post level or as broad as aggregated monthly data. So, what’s the math?
Let’s say “X” is your reach—we’ll use the total number of Facebook page likes (you can also use Twitter followers) recorded monthly—and “Y” is your average engagement per post (total shares, likes, etc.) for a month. Chart them in a spreadsheet and use the “slope” function to calculate the acceleration of your return on each post. In this example, it takes close to seven new page likes to increase the number of engaged users by one. To get the growth quality index, you simply divide 1 by the slope. Theoretically (though quite improbably), the best result you could realize would be an index of one—meaning every new additional added follower is a fully and actively engaged follower. But long term, you should probably be extremely happy to see an index of around .20.
Example: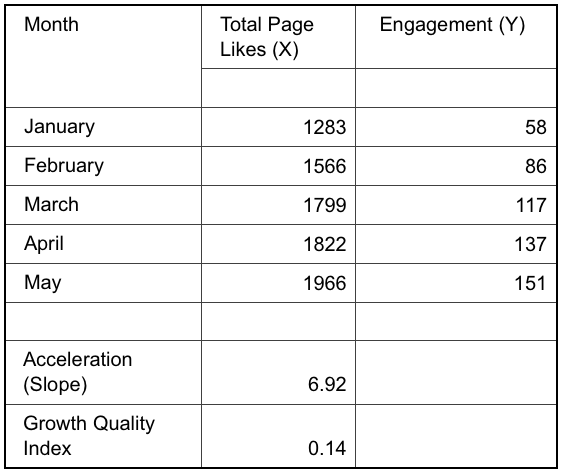 Acceleration (Slope) | 6.92 Growth Quality Index | 0.14
What’s the value of a social mention?
Now that we’ve talked about determining the quality of your social growth, how can you put a dollar value on their engagement? The value of a social mention is a tangible way to determine the relative ROI on your social engagements versus traditional display advertising. The value of a social mention may often simply be calculated by dividing the number of impressions by 1,000 and then multiplying the result by your average cost per thousand (CPM) impressions.
(social impressions/1000) x average CPM for display advertising = VSM
But this formula, with no factor for the inherent costs of creating the social post, tends to overvalue the return on social. A more accurate measure may be derived by dividing the number of impressions by 1,000, then multiplying the result by your average cost per thousand (CPM) impressions, and then subtracting the average cost per post creation. Figuring the average creation cost for content can be somewhat complicated, depending on how granular your cost measures and inputs are, but at the very least, you should understand your cost per labor hour and the time spent creating all of your posts (writing, design, trafficking, et al) within a time period (weeks, months, etc.) divided by the number of posts created.
(social impressions/1000) x avg CPM for display advertising – avg creation cost per post = VSM
Including this metric on your dashboard provides you with a good indication of how much you’re actually spending to generate and promote your message on what’s long been perceived as a “free” media channel and, more important, ensures your resources are dedicated and managed appropriately, given the actual value.
Know your average conversion cost by lead channel.
This metric is all about budget prioritization based on the relative quality of engagement by channel—for example, organic or paid social versus email marketing, display advertising, pre-roll, SEO or SEM, etc. It’s a relatively simple calculation; the dollars spent by channel divided by the conversions attributable to each channel. Again, theoretically, you should be putting your budget dollars into whatever delivers the lowest cost per conversion, be they registrations, subscriptions, downloads, or actual sales. The trick, of course, is to know at what level of spending you have exhausted opportunities within that medium to the point that additional dollars become less and less effective. You then move a higher percentage of your budget to the next most-effective medium.
Figure out your average lead quality with… more math.
Using some of the same data as in the measure above, the theory behind the average lead quality measure is that all leads are not of the same value to your business. The dollars you’re spending should be applied toward those tactics/media that deliver the highest-quality leads. Whereas the average conversion cost by lead channel assesses the effect of your media mix on filling the funnel, average lead quality measures what percentage of those leads ultimately converts to a sale. Again, the math is fairly simple.
(incoming leads) divided by (executed contracts/# of sales) = average lead quality (%)
As a sole measure, average lead quality at any point in time is of limited value. But measured over time and analyzed in conjunction with other input variables or tracked KPIs, it can indicate your media strategy, target segmentation, or campaign messaging is no longer hitting or attracting the right customers. Of course, an increasing average lead quality percentage means you are doing a better job of attracting the customers who are most likely to buy to the conversion funnel—a good sign. If the percentages decline over time, you have to begin to question your targeting approach.
No more math! Find your top five drop-off locations.
Finally, we get to a spot where there’s no math involved! Most marketing dashboards stick strictly to the positive metrics. But understanding where and maybe why users drop off the path to conversion demonstrates where you may have weakness in your sales messaging and/or relevancy. Turning to your Google analytics account, look for the URLs associated with the highest drop-off rates. If they remain the same week after week, there is an opportunity to optimize the UX or UI to increase stickiness—or at least reduce drop-offs.
Your mileage may vary.
There is no single set of metrics that is best for every business. It all depends on what behaviors drive your most important KPIs. But there should always be room on your dashboard for metrics like these to expand your understanding beyond what is happening and point you toward an understanding of why you are achieving the results you see and how you can improve.